Explore
Featured
Recent
Articles
Topics
Login
Upload
Featured
Recent
Articles
Topics
Login
Upload
Search Results for 'line plots'
line plots published presentations and documents on DocSlides.
Chapter 5 Two-Dimensional Plots
by pasty-toler
5.0. This chapter will cover 2D (two-dimensional)...
More stuff on plotting
by jane-oiler
Define x and y and call the plot function. Engine...
Oct 31 2014
by faustina-dinatale
Mega Food Park -Karnataka . An MoFPI & Future...
Overview
by tawny-fly
plot in 2D. Plot in 3D. Other possible charts. En...
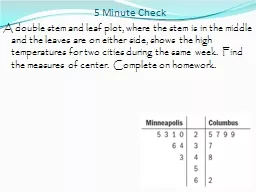
5 Minute Check
by debby-jeon
A double stem and leaf plot, where the stem is in...
Introduction to R Graphics
by liane-varnes
Delia . Voronca. 2013. Objectives. Create . basic...
Identify patterns and Make Predictions from Scatter Plots
by tatiana-dople
4. 3. 2. 1. 0. In addition to level 3.0 and beyon...
DIMACS BioMath Connection
by natalia-silvester
Q&A. Field Tester Workshop. July 10, 2009. Ho...
Scatter Plots Find the line of best fit.
by pamella-moone
4. 3. 2. 1. 0. In addition to level 3.0 and beyon...
Scatter Plots Find the line of best fit.
by calandra-battersby
4. 3. 2. 1. 0. In addition to level 3.0 and beyon...
Frequency Tables and Line Plots
by trish-goza
Essential Question. :. How . can information be g...
Lesson 14: From Ratio Tables, Equations, and Double Number Line Diagrams to Plots on the Coordinate
by lindy-dunigan
Exercise 1 Create a table to show the time it wi...
Bruce Mayer, PE
by olivia-moreira
Licensed Electrical & Mechanical Engineer. BM...
Constructing scaled plots from metes and bounds
by karlyn-bohler
What do we know?. We’ve reviewed how surveyors ...
Box and Whisker Plots
by lindy-dunigan
. Order numbers. 3, 5, 4, 2, 1, 6, 8, 11, 14, 1...
Statistics: Using Scatter Plots
by natalia-silvester
Vocabulary. Bivariate. Scatter Plot. Positive Cor...
making predictions
by tatyana-admore
line of best fit. scatter plots. interpolation. e...
Box and Whisker Plots Order numbers
by lindy-dunigan
3, 5, 4, 2, 1, 6, 8, 11, 14, 13, 6, 9, 10, 7. Fi...
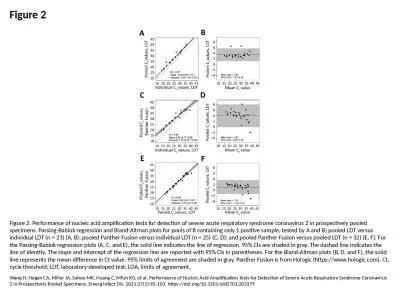
Figure 2 Figure 2. Performance of nucleic acid amplification tests for detection of severe acute re
by bitsy
Wang H, Hogan CA, Miller JA, Sahoo MK, Huang C, Mf...
Residuals and Residual Plots
by hailey
How close is the Line of Best Fit?. One additional...
MATLAB ( MATrix LABoratory
by shoffer
). Un lenguaje de programación . orientado a reso...
Box and Whisker Plots A diagram that summarizes data by dividing it into four parts.
by natalia-silvester
It compares two sets of data.. Box and Whisker Pl...
1-5 Scatter Plots and Trend Lines
by luanne-stotts
Objectives. Create and interpret scatter plots.. ...
Box Plots
by test
Lesson . 8.04. After completing this lesson, you ...
Box and Whisker Plots
by briana-ranney
A diagram that summarizes data by dividing it int...
Load More...